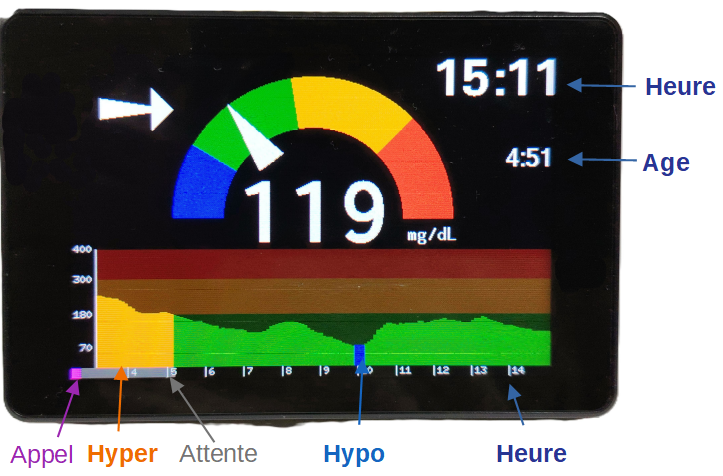
Home Screen
The home screen displays the following information:
- Center: The most recent blood glucose reading in mg/dL.
- Left: The trend arrow, as defined by the patient’s app.
- Top Right: The current time.
- Below the time: The “age” of the reading. It turns orange if the data is older than 10 minutes, and red if older than 15 minutes.
- Bottom Section: A glucose history graph covering approximately 10 hours.
- Blue: Hypoglycemia.
- Green: Normal range (thresholds are based on the patient’s app settings).
- Orange: Hyperglycemia.
- Red: Above 300 mg/dL.
- Purple Cursor: The width of the small purple cursor reflects the “Cloud” response time for a data request. A narrow cursor means everything is working smoothly.
- Gray Cursor: Indicates the countdown until the next data request. The wait is 2 minutes if the reading is recent, or 30 seconds if the reading is outdated.
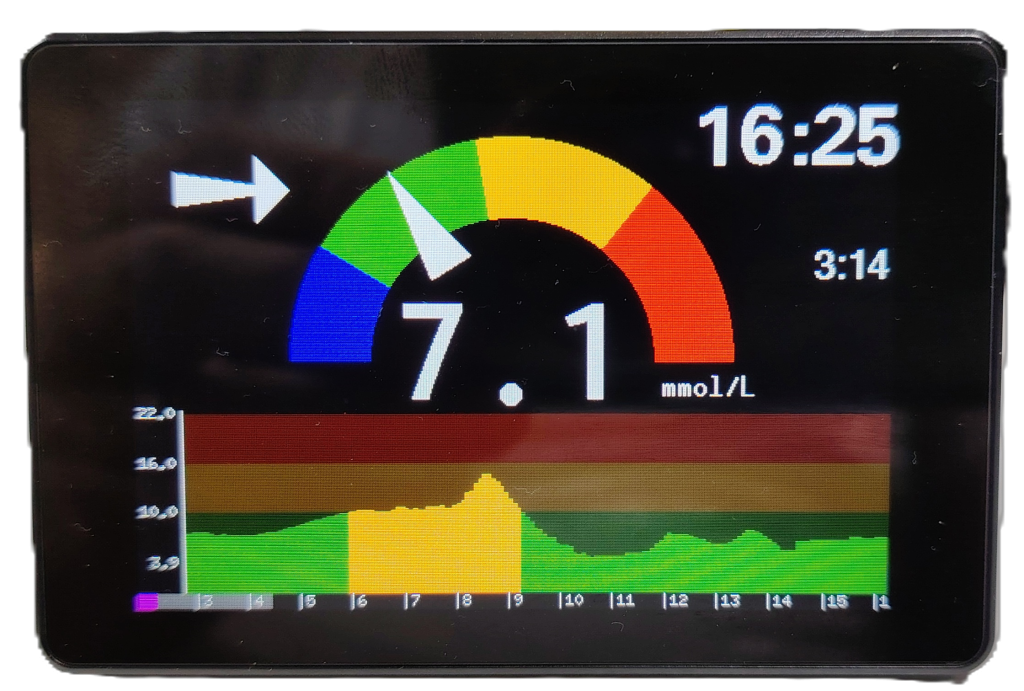
The central blood glucose value can be displayed in white or in color.
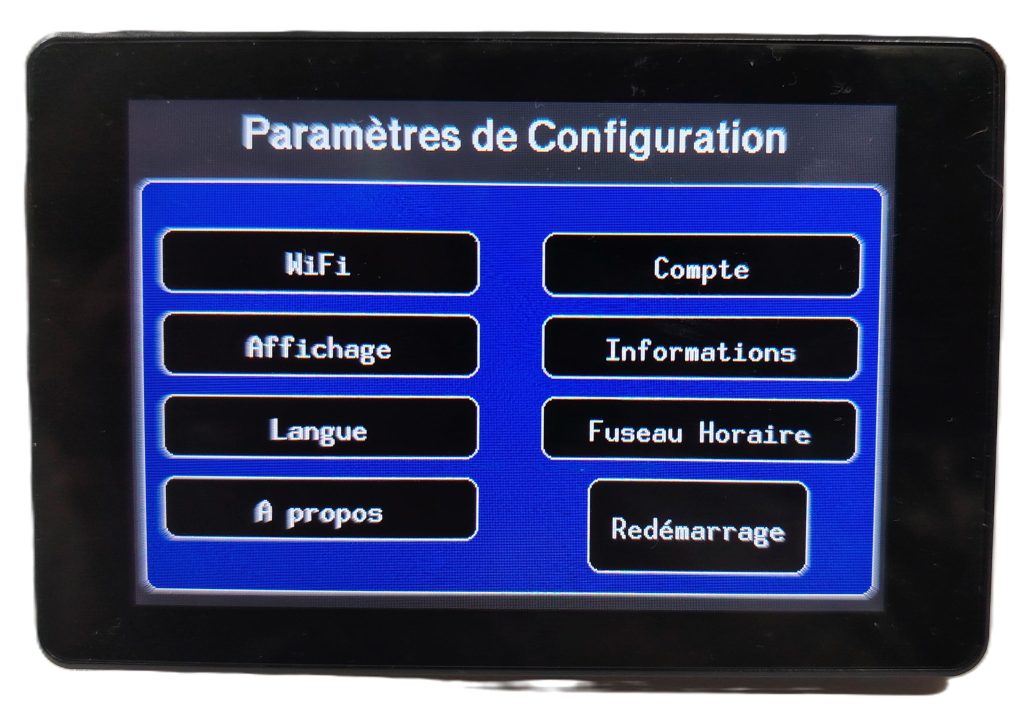
Configuration
By swiping the home screen to the left, you can access the Configuration Settings screen. From here, you can update WiFi settings (useful when traveling), modify LibreLinkUp account details, etc.
In case of any issues, you can also force a reboot of the Gluco-Monitor.
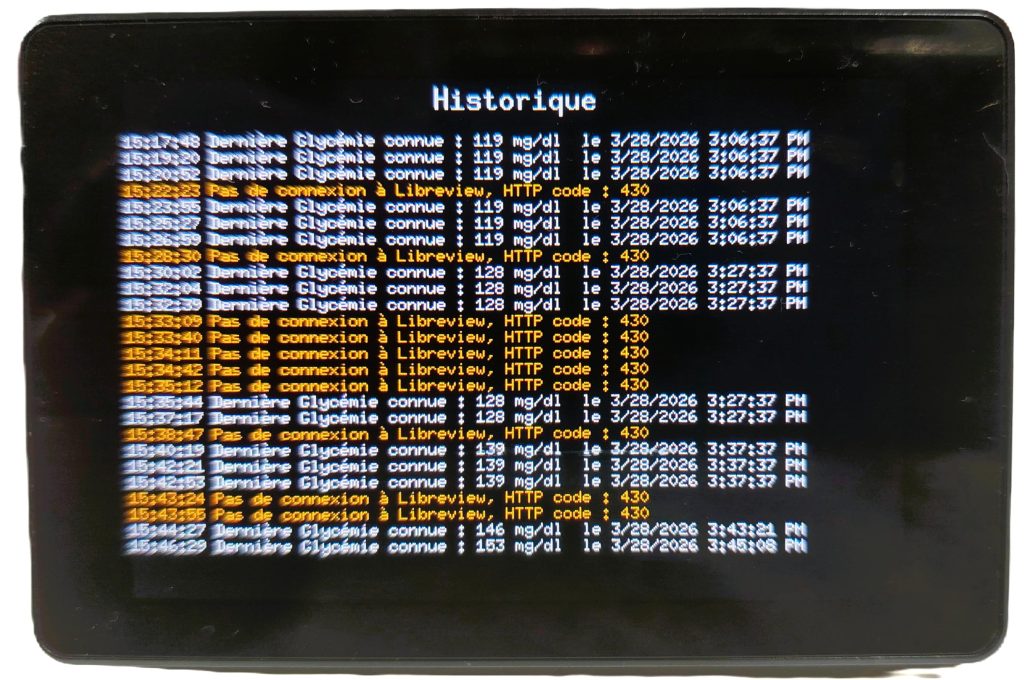
History (Logs)
This section lists the main events, such as successful or failed WiFi connections and, most importantly, calls to the “Cloud” to retrieve glucose data.
- White text: Successful connection.
- Orange text: Data was not received.
A few orange lines are acceptable; Gluco-Monitor will automatically retry the request shortly after.